Evaluate a range of threshold values for creating binary images
thr.check.RdConverts an image to grayscale, applies a user defined threshold range to segment the binary the image, and then plots segmented images that reflect 9 discrete values in the range.
thr.check(img, min = NULL, max = NULL, otsu = TRUE, plot.grid = TRUE)Arguments
- img
character, a path to an image file.
- min
numeric, the minimum threshold value (0-1).
- max
numeric, the maximum threshold value (0-1).
- otsu
logical, should the automatically determined threshold value be printed. See Details.
- plot.grid
logical, should the grid of images be plotted.
Value
If 'otsu=TRUE', a single automated threshold value is returned using Otsu's method. See otsu.
Details
Displays a grid of 9 images as an R raster graphic, each the result of 9 discrete values within the range describe by min and max. If both min and max are NULL, then the threshold range is defined by the default seq(0.1,0.9,.1). This function should help users refine threshold values for detecting ROIs with kin.search and kin.simple if automatic thresholding using Otsu's method is not satisfactory.
See also
kin.simple, kin.search, otsu
Examples
#access image in system
y <-system.file("extdata/img", "sunfish_BCF.jpg", package = "trackter")
# default values
thr.check(y)
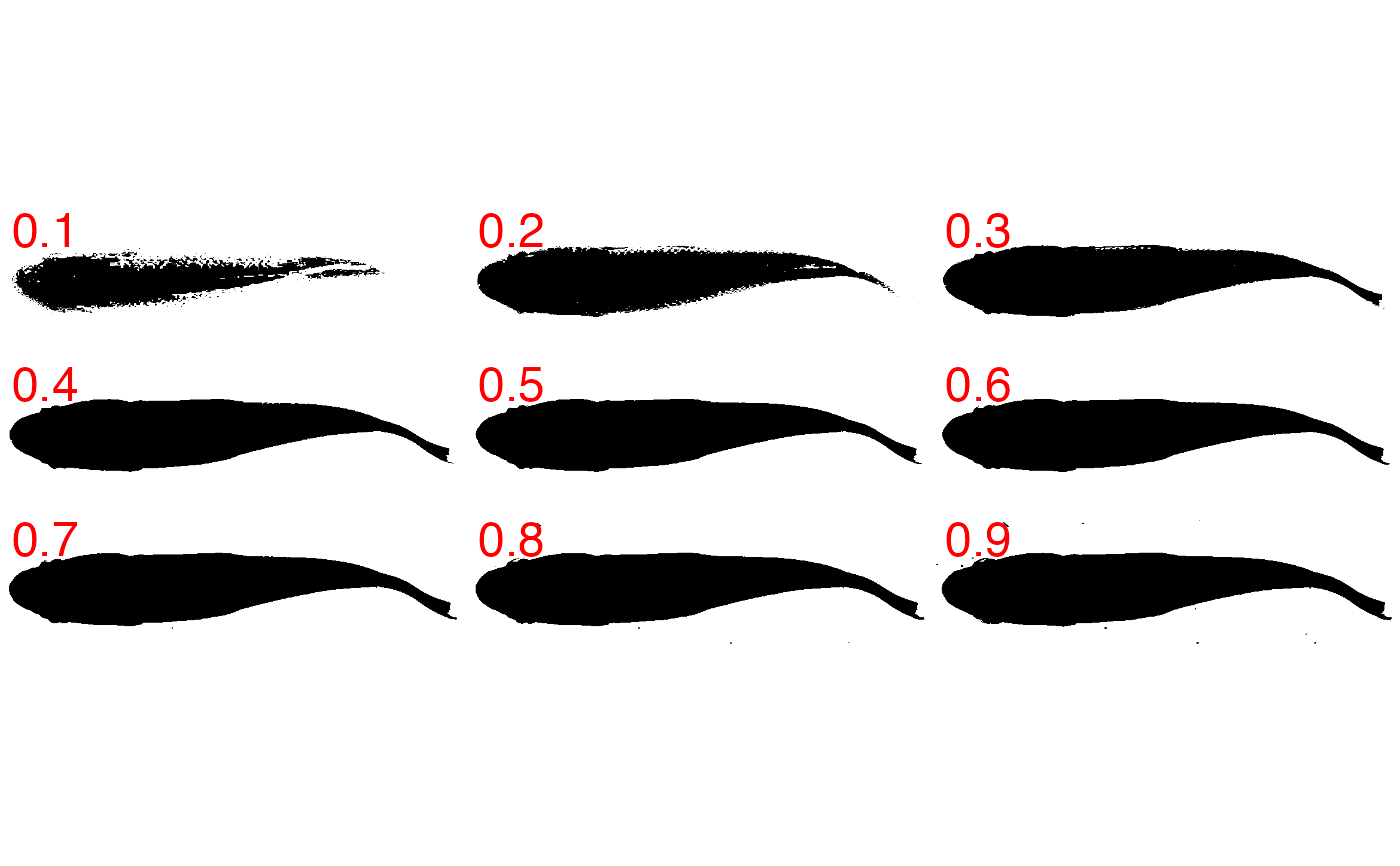 #> [1] 0.5605469
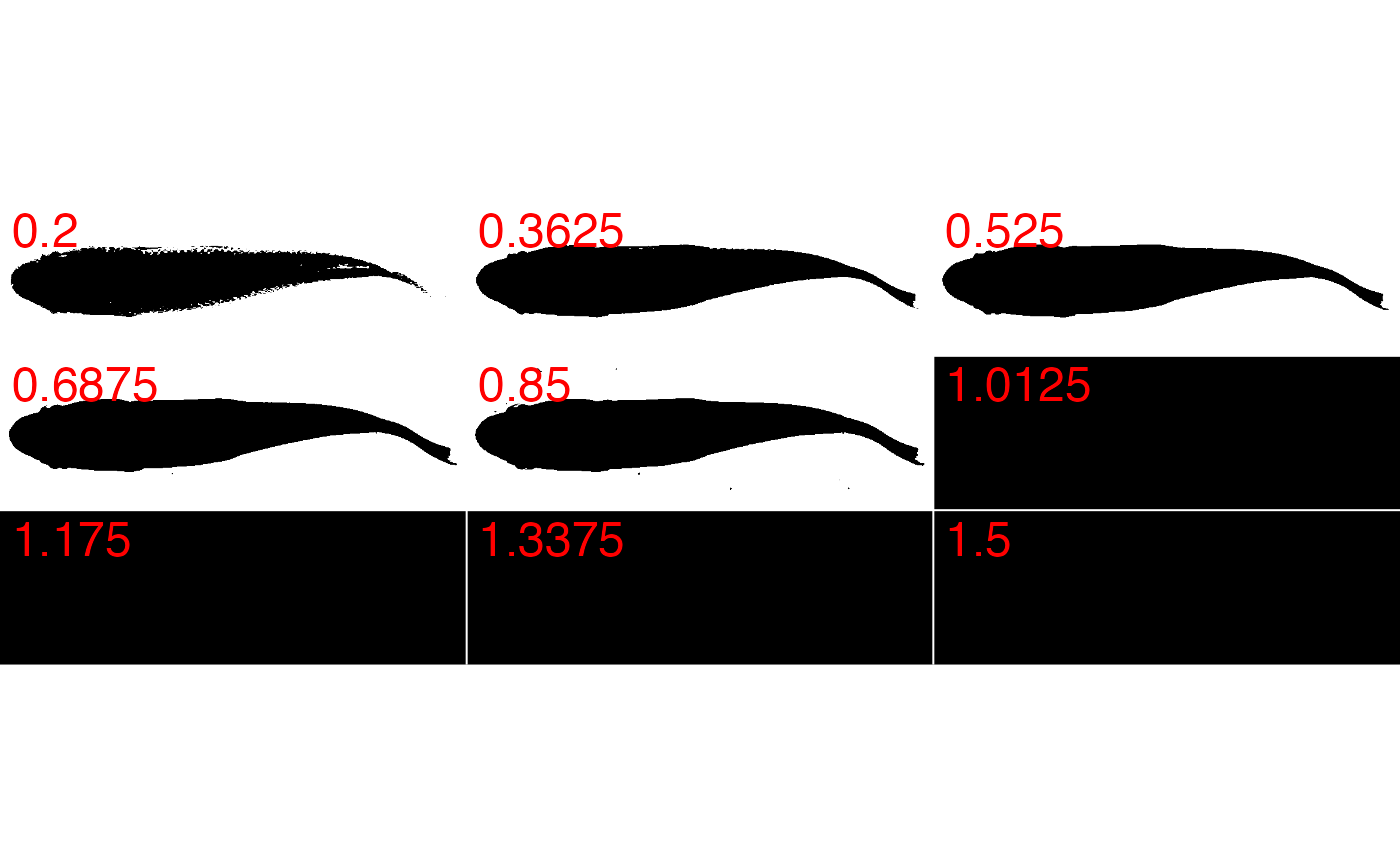
#custom values
thr.check(y,min=0.2,max=1.5)
#> [1] 0.5605469
#custom values
thr.check(y,min=0.2,max=1.5)
 #> [1] 0.5605469