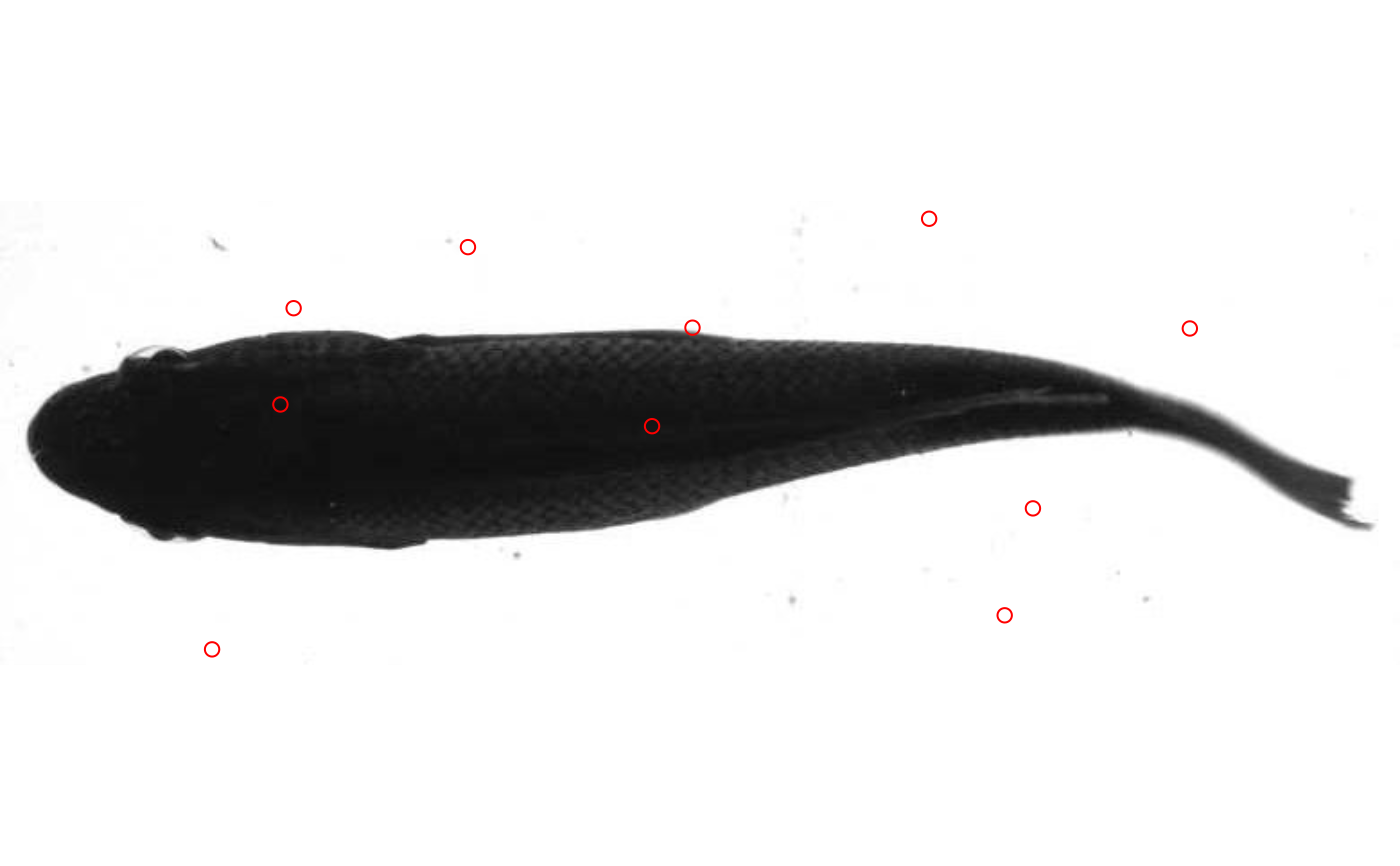
Plot data over an image
data.overlay.RdSimple wrapper for points to plot data derived from an image over that image.
data.overlay(img, over, ...)Arguments
- img
character, an image file path.
- over
a data frame, data table, or matrix with two columns, the first representing x and the second y coordinates.
- ...
other arguments to be passed to
points
Value
The image is plotted in the graphics device with points given in x
Details
Simply plots 2D dimensional data over the image specified in img. May be useful in plotting output from trackter's kin functions.